Nov 5, 2026
Showing a Power BI dashboard on a TV: how to keep everyone up to date on the numbers
Want to show a Power BI dashboard on a TV? Learn which options you have, what to watch for with security and how to design a dashboard for a big screen.
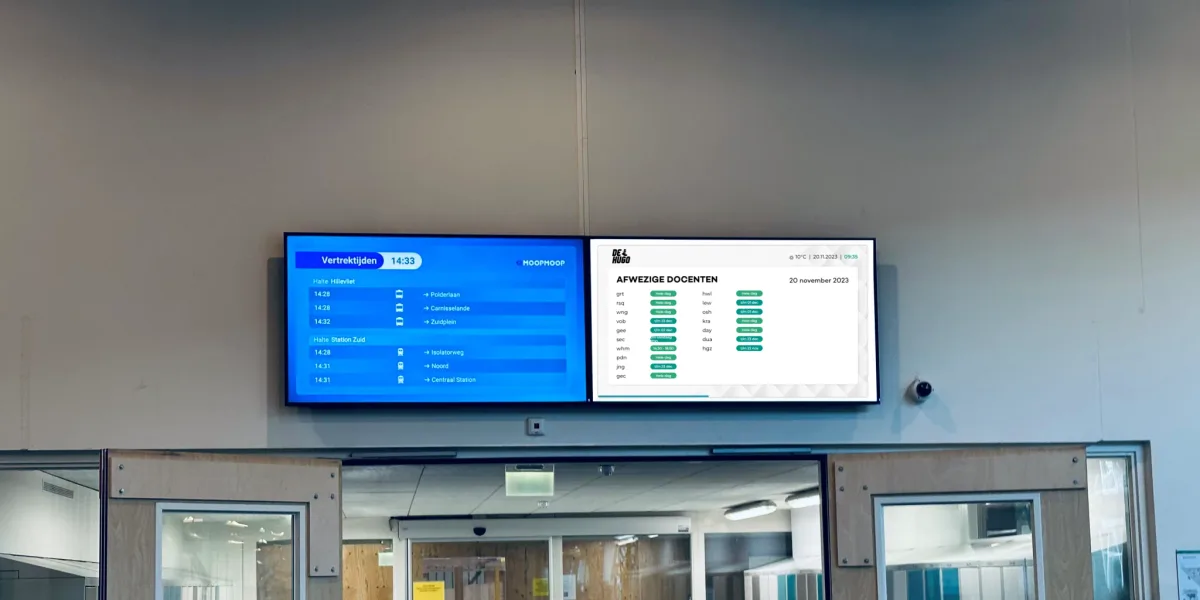
Many organizations use Power BI, but the numbers often stay hidden behind a login. Only the people who open the report can see how things are going. Put a Power BI dashboard on a TV in the office, the cafeteria or the warehouse, and the whole team can see at a glance where things stand. In this article you'll learn how to show a Power BI dashboard on a TV, which options you have and how to create a dashboard that works well on a big screen.
Why put a Power BI dashboard on a screen?
Numbers that are visible come to life. A sales team that sees daily revenue climbing gets motivated. A warehouse that sees the open orders can adjust right away. And a customer service team that can see the wait time brings in extra people faster.
- Everyone works with the same numbers, without anyone having to open a report.
- You spot deviations immediately and can step in sooner.
- Successes become visible, which is good for motivation.
- You need to email separate updates or discuss them in meetings less often.
Three ways to show Power BI on a TV
1. A PC with a browser in kiosk mode
You connect a PC to the screen, sign in to Power BI and set the report to full screen. That works, but it has drawbacks. Someone has to stay signed in, sessions expire, Windows or browser updates suddenly put a notification on screen, and a PC that runs all day uses power. On top of that, you can only show one report at a time this way.
2. Publish to web
Power BI has a feature that lets you publish a report publicly via a link. You can open that link on a screen without signing in. The big drawback: anyone who has the link can view the report. According to Microsoft, there is then no security or authentication at all. So only use this option for data that can truly be public. Many organizations have disabled the feature for that reason.
3. An integration through digital signage software
With digital signage software, you show Power BI dashboards on your screens alongside your other content. With the Stremo Power BI integration you connect your report once and choose which page or tile appears on the screen. The dashboard refreshes automatically and nobody has to sign in to see the numbers.
Because the dashboard is a regular content block, you can include it in a playlist. That means you can alternate several dashboards with news, birthdays or safety notices. You decide per screen or screen group which dashboard appears when. That way the screen in the sales department shows different numbers than the screen in the warehouse.
When setting it up, check with your IT department or Power BI administrator which license and sharing settings you need. That way you can be sure the integration fits within your organization's policies.
Designing a Power BI dashboard for a big screen
A dashboard that works fine on a laptop is often unreadable on a TV on the wall. People look at a screen from a few meters away and for only a few seconds. So keep these tips in mind.
- Limit yourself to four to six key figures per page. Someone walking by can't take in more than that.
- Use large fonts. You should be able to read a number from five meters away.
- Choose clear, high-contrast colors and use red and green only to flag something.
- Leave out filters, slicers and small tables. Nobody can click on a screen.
- Create a separate page for each audience, for example one for sales and one for operations.
- Show the time of the last update, so everyone knows how current the numbers are.
Pay attention to how often your data refreshes
A dashboard is only as current as the underlying dataset. In Power BI, you set how often the data is refreshed. With a Pro license, scheduled refresh can run up to eight times a day; with Premium, up to 48 times a day. Truly real-time numbers require other solutions, such as a live connection to the source. Decide in advance how current the numbers on the screen need to be.
Privacy and sensitive numbers
Not every number belongs on a screen that everyone walks past. Think about who can see the screen: only employees, or visitors and suppliers too? Don't show personal data, such as names with individual performance, unless it's necessary. That's also in line with the GDPR. If in doubt, create a separate version of the report with only the numbers that can safely be visible.
Examples of Power BI dashboards on a screen
- Sales: daily revenue, number of deals, progress toward the monthly target.
- Customer service: queue, average wait time, customer satisfaction.
- Manufacturing and logistics: output per line, open orders, on-time delivery.
- Healthcare: occupancy, wait times, number of appointments that day.
- Facilities: occupancy of workspaces and meeting rooms.
You'll find more examples under dashboard screens and the other integrations for data and dashboards.
Frequently asked questions
Do I need a Power BI license to show a dashboard on a screen?
To create and share reports, you need a Power BI license within your organization. Exactly which license depends on how you share. Check with your IT department.
Can I alternate between multiple dashboards?
Yes. With a playlist, you rotate multiple dashboards or pages and combine them with other content.
Does this work across multiple locations?
Yes. You place the dashboards in screen groups and decide per location which numbers appear on screen.
Make your numbers visible
A dashboard that nobody opens doesn't deliver anything. With a Power BI dashboard on a screen, you make the numbers visible to the whole team. With the Stremo Power BI integration, you connect your report once and from then on it runs automatically. Request a demo or try Stremo free for 14 days.